


DIAGRAMS: A PROJECT BY
REM KOOLHAAS AMO/OMA AT FONDAZIONE PRADA VENICE
May 10, 2025 – November
24, 2025
Venice, 7 May 2025 –
Fondazione Prada presents “Diagrams”, an exhibition project conceived by
AMO/OMA, the studio founded by Rem Koolhaas, in its Venetian venue, Ca’ Corner
della Regina, from 10 May to 24 November 2025.
“Diagrams” investigates
the visual communication of data as a powerful tool for constructing meaning,
comprehension or manipulation and a pervasive instrument for analyzing,
understanding and transforming the surrounding world. It seeks to foster
dialogue and speculative reflection on the relationship between human
intelligence, scientific and cultural phenomena, and the creation and
dissemination of knowledge.
The exhibition, on view
on the ground and first floors of the 18th-century Palazzo Ca’ Corner della
Regina, gathers more than 300 items, including rare documents, printed
publications, digital images, and videos, spanning from the 12th century to the
present day and related to various geographical and cultural contexts. This
material is displayed according to a thematic principle that reflects not only
contemporary world urgencies but also, de facto, demonstrates the diagram’s
transversal and diachronic nature.
The project benefits from
the extensive research conducted by Fondazione Prada in close collaboration
with Rem Koolhaas and Giulio Margheri, Associate Architect at OMA. The
expertise of Sietske Fransen, Max Planck Research Group Leader, Bibliotheca Hertziana
– Max Planck Institute for Art History, was instrumental.
As stated by Rem
Koolhaas, “In my view, the diagram has been an almost permanent tool. For
example, in the early stages of our research, we discovered three-dimensional
diagrams from South Africa dating back to 40,000 BCE, as well as wood-carved
maps of the Greenlandic coastline made on the island of Ammassalik. This
demonstrates that the diagram is an enduring form of communication that adapts
to whatever medium exists at the time. Regardless of the medium, a diagram
serves didactic (explanatory) or suggestive (persuasive) purposes. This means
that it not only exists by default in any new medium but can also be applied to
virtually any area of human life. Fashion, religion, or the history of social
inequality can be interpreted as a diagram. I deeply enjoy this
interdisciplinary aspect of the diagram, its invariable attribute—its
independence from language (words) makes it one of the most effective forms of
representation.”
A diagram can be roughly
described as an instrument for envisioning information to reason about,
communicate, and document, so that it appears as a neutral and objective
representation. Drawing on Gilles Deleuze’s assertion that “the diagram is the
possibility of a fact, not the fact itself,” the exhibition explores the
diagram as an agent of meaning-making that actively shapes and influences human
thought and life, and potentially becomes a vehicle for misconceptions or a
tool of propaganda and political struggle.
The exhibition system,
designed by AMO/OMA according to the “now urgencies” principle, is structured
according to nine primary topics: Built Environment, Health, Inequality,
Migration, Environment, Resources, War, Truth, and Value. These themes are
illustrated in the central room of the first floor in a series of vitrines
arranged in parallel to one another. Each of the so-called “now urgencies” is
further explored in a lateral room on this floor, with different display
formats that help investigate specific subthemes or the work of a prominent
author. This complex and diverse investigation is introduced on the ground
floor by a set created by AMO/OMA, which can be defined as a diagram of the
exhibition, composed of diagrams. This meta-diagram reveals the research and display
methods in all their transparency and accuracy.

The starting point of
“Diagrams” is the work of W.E.B. Du Bois (1868–1963), the African American
sociologist renowned for his studies and infographics on African-American
communities in the late 19th and early 20th centuries. The charts he created
for “The Exhibit of American Negroes” at the Exposition Universelle in Paris in
1900 serve as an initial reference for exploring the communicative power of
graphic representation, as well as its potential for social inquiry and
activism. These works mark a pivotal moment in the foundation for the eventual
rise of mass communication. This case study highlights how infographics have
addressed, communicated, and often omitted issues related to social justice,
racism, the representation of ethnic and religious minorities, and identitarian
questions.
The exhibition also
delves into the limitations of infographics in terms of their communicative
capacity and the audience’s ability to interpret them accurately. In this
framework, the case of the English founder of modern nursing, Florence
Nightingale (1820–1910), highlights how clear visual communication in the
medical field led to significant legislative progress aimed at improving
healthcare conditions. This case study functions as a gateway to exploring a
substantial body of documents and manuscripts related to this scientific
domain, sourced from ancient cultures around the world. It demonstrates that
the application of infographics is neither a recent phenomenon nor an
exclusively Western one, and that it continues to have a tangible, meaningful
impact on people’s lives. This section also initiates a broader discussion
about the intersection of scientific progress and body care, particularly at
present when the effects of ageing, the temporal limits of human existence, and
the cultural emphasis on physical health and wellness are central in the public
and media debate.
Another significant
thematic strand focuses on war. The diagram of Napoleon’s campaign in Russia,
created by the French civil engineer Charles Joseph Minard (1781-1871), is
widely considered to be a milestone in the graphical representation of data.
The exhibition develops a dialogue that connects Minard’s visual innovations
with those of the Scottish political economist William Playfair (1759-1823),
propaganda graphics from 20th-century regimes, and the investigative work of
contemporary studios.
The 19th century,
referred to as the Golden Age of Infographics, is a point of departure for
reflecting on the use and misuse of data in communicating sociopolitical
knowledge. In the early part of the century, the advent of new printing
techniques coincided with the rapid expansion of education. In this historical
context, pioneering American feminist educator Emma Willard (1787–1870)
published history and geography textbooks featuring innovative and creative
maps of time, which helped translate data and information into manageable
visual forms. The exhibition also demonstrates how diagrams can simultaneously
serve as ambiguous instruments for distorting narratives, enhanced by the
overwhelming power of big data and a fragmented communication landscape driven
by social media and online platforms.
In the 18th and 19th
centuries, a growing interest in the natural sciences and ecology emerged in
infographic production. The German naturalist and explorer Alexander von
Humboldt (1769–1859) was a significant figure. Von Humboldt’s graphics and
diagrams represent the foundation for a discourse on data visualization and the
communication of ecological knowledge. This discussion assumes even greater
significance in light of today’s critical climate challenges.
The earliest examples of
infographics are linked to astronomical, geographical, or religious knowledge
and were designed for limited circulation among cultural and intellectual
elites. This is true not only in Europe but also in Arab, Asian, and
Mesoamerican cultures, a fact that encourages reflection on the shared cultural
horizons of certain ancient civilizations. For this reason, diagrams emerge as
explicit agents of meaning-making and, at times, consensus building, often
rooted in religious, political, or philosophical traditions.
The continuous interplay
between the ancient and the modern, which defines the exhibition’s narrative,
fosters a reflection that intertwines the form and content of diagrams.
Infographic communication formally evolved in the 20th century, influenced by
historical avant-gardes. Modernism's significant contributions to visual
communication enable a retrospective reassessment of the formal, aesthetic, and
artistic qualities of ancient and pre-modern infographics.
Central to the exhibition
is also AMO/OMA’s design practice, which has integrated diagrammatic forms as
architectural tools since the 1970s. As Koolhaas explains, “Complex ideas are
almost an intellectual or sometimes artistic pleasure, and they became a
driving element in what we were trying to do. In this context, diagrams were
incredibly helpful. By researching and designing them, we were trying to form a
space or to define another architecture, the form of which required an enormous
amount of argument and articulation. We would not have come close to that if I
had not discovered a number of diagrams. The role of diagrams was crucial at
that time because we needed the physical burden of proof to show that what we
wanted to achieve was possible. Today, I may find myself in a different
position, where I no longer have to prove that things are possible, and that
certainly changes the nature or the role of diagrams. But I would still say
that diagrams are an important part of my repertoire.”
The exhibition also
includes the contributions of other significant and recent environmental design
and urbanism practices developed by international platforms like Atmos Lab and
Transsolar, as well as by investigative practices and scholars such as Theo Deutinger
and SITU Research.


ELWIN J.
WOODWARD
Historic and
Prophetic Diagram of the World:
God’s Plan of
Salvation for Law Breakers, 1912
Colored
Lithograph, Exhibition Copy
David Rumsey
Map Collection, David Rumsey Map Center,
Stanford
University Libraries
Courtesy
David Rumsey Map Collection,
David Rumsey
Map Center, Stanford University Libraries
This chart summarizes in a diagram the history of mankind from a Christian theological perspective, also providing an eschatological prophecy about the future. Each event, date or fact represented is linked to numbers 1 to 30 on the top and bottom and to letters A to Z on the sides. Numbers and letters refer to a more comprehensive discussion in the volume to which this chart was attached.

ELWIN J. WOODWARD
Historic and Prophetic Diagram of the World:
God’s Plan of Salvation for Law Breakers, 1912 (Detail)


ED HAWKINS
Temperature
Changes Around the World Between 1901 and 2018, 2019
Published by
BBC on June 21, 2019. Digital image.
From BBC News
at bbc.co.uk/news and Prof. Ed Hawkins, National Centre for Atmospheric
Science, University of Reading, UK www.ShowYourStripes.info
Courtesy BBC
News
Created by Professor Ed Hawkins for the BBC, this diagram uses color to represent climate change in different areas of the world in the last century. As the time dimension approaches the present day, the temperatures become higher relative to the annual average.

AMO
Top 10
Destinations of Students Studying Abroad From China and From the USA
and The Top 6
Destinations of Students Studying Abroad From the EU, 2008
Reflection
Group on the Future of the EU 2030, Digital Image
Courtesy
AMO/OMA
Realized by AMO for the “Reflection Group on the Future of the EU 2030” contest, these two diagrams show migration flows of students from China, Europe, and the United States and their chosen destinations.

ITALIAN
POSTAL SAVINGS BANKS. NUMBER OF PASSBOOKS.
AVERAGE PASSBOOK
AND TOTAL DEPOSIT AT THE
END OF EACH
MONTH FROM 1876 to 1880, 1888
Printed Book
In Antonio
Gabaglio, Teoria Generale di Statistica (Milano: Ulrico Hoepli, 1888)
Fondazione
Giangiacomo Feltrinelli, Milano
Courtesy
Fondazione Giangiacomo Feltrinelli, Milan
In this diagram, Antonio Gabaglio represented the number of post-office passbooks issued and the average sum of total deposits at the end of each month from 1876 to 1881. The chart is often given as an example in books dealing with on the history of data visualization.

W.E.B. DU
BOIS
Conjugal
Condition of American Negroes According to Age Periods, c. 1900
Exhibition
Copy of a Statistical Chart Illustrating the Condition of the Descendants of
Former African Slaves Now in Residence in the United States of America, Atlanta
University. Ink and Watercolor on Paper
Daniel Murray
Collection, Prints and Photographs Division, Library of Congress, Washington,
D.C. Courtesy Library of Congress, Prints and Photographs Division Washington,
D.C., Daniel Murray Collection
This ink and watercolor chart is part of a set created by William Edward Burghardt Du Bois (1868–1963) and his students at Atlanta University for the “Negro Exhibit of the American Section” at the 1900 Paris Exposition Universelle. The aim of the exhibition was to highlight the social progress of Black communities since the abolition of slavery in the United States in 1865. The chart shows the percentages of African Americans who are single, married, or widowed, grouped by age and gender. As a milestone in the history of data visualization, this project represents an advanced and innovative approach to communication, raising awareness on the topic of civil rights.


AMO/OMA
Model for the
“Diagrams” Exhibition, Ca’ Corner della Regina, Venice.
Courtesy AMO/OMA, Photo by Frans Parthesius


AMO/OMA
Model for the “Diagrams” Exhibition, Ca’ Corner della Regina, Venice.
Courtesy AMO/OMA, Photo by Frans Parthesius


YVES
TROTIGNON
The English,
French, Italian, German, Spanish, Dutch,
Muslim
Civilizations in the 18th Century, 1950
School map
Published by Librairie Hatier, Rue d’Assas, Paris,
Printed by
Imprimerie Michard, Paris.
Print on Paper Private Collection


CORNELIUS
HUGH DE WITT
Sankey
Diagram of the Product Flows and Food Waste Generated
Along the
Food Supply Chain in Europe in 2011, 2019
Digital Image
In Carla
Caldeira, Valeria De Laurentiis, Sara Corrado, Freija van Holsteijn, Serenella
Sala, “Quantification of Food Waste per Product Group along the Food Supply
Chain in the European Union: a mass flow analysis”, in “Elseiver.” Resources,
Conservation and Recycling, vol. 149 (October 2019), modified from VHK, Kemna
et al., 2017 Courtesy VHK
© VHK for
European Commission 2016 Source: VHK, Kemna et al., 2017
In this flow chart—also known as a Sankey diagram—the arrows’ width is proportional to the flow quantity. In this case, food production, distribution, consumption, and waste are analyzed to record food waste in the European Union.


JOHN AULDJO
Map of
Vesuvius Showing the Direction of the Streams of Lava in the
Eruptions
From 1631 to 1831, 1832 Exhibition Copy From a Printed Book
In John
Auldjo, Sketches of Vesuvius: with Short Accounts of Its
Principal
Eruptions From the Commencement of the Christian Era to the
Present Time
(Napoli: George Glass, 1832)
Olschki 53,
plate before p. 27, Biblioteca Nazionale Centrale di Firenze, Firenze
Courtesy
Ministero della Cultura – Biblioteca Nazionale Centrale di Firenze. Any
Unauthorized Reproduction by any Means Whatsoever is Prohibited.
This plate is part of a series of volcanological studies carried out by Canadian scholar John Auldjo in the 19th century. The author used different colors to represent the direction and various layers of lava on Mount Vesuvius over the two centuries from 1631 to 1831.


WILLIAM
PLAYFAIR
Universal
Commercial History From 1500 to 1805, 1805
Printed Book
In William
Playfair, An Inquiry Into the Permanent Causes of the Decline and
Fall of
Powerful and Wealthy Nations (London: W. Marchant Printer, 1805)
STRONG ROOM
OGDEN B 47,
UCL Special
Collections, London UCL Special Collections, London
The visualization of ever-changing long-term and globally collected data lies at the heart of the plates produced by Playfair (1759-1823), a pioneer of infographics and data visualization. This volume contains hand-colored engraved charts of worldwide economic histories and international relationships. By analyzing trends and patterns in the economic histories of ancient empires, Playfair aimed to prevent British national decay by advocating sustainable economic and social policies.


AMO/OMA
Timeline, 2025
Courtesy
AMO/OMA
Distribution
of Diagrams on Display by Topic and Year of Production.


PHILIPPE RAHM
ARCHITECTES
Farini
Environmental Devices, 2019
Digital Image
In “Agenti Climatici”, Proposal for the Scalo Farini and San Cristoforo
Competition in Milan by Laboratorio Permanente, OMA with Vogt, Philippe Rahm,
Ezio Micelli, Temporiuso, Arcadis, Net Engineering
Courtesy
Laboratorio Permanente, Milano


PHILIPPE
REKACEWICZ
The African
Big Wheel, 2007
The Wheel
Symbolizes Permanence and Continuity in the Context of a
Profoundly Unequal
Exchange, Drawing, Color Pencil and Ink, Exhibition Copy
Courtesy
Philippe Rekacewicz
© Philippe
Rekacewicz
Through his work, the French geographer, cartographer, and information designer Philippe Rekacewicz highlights social injustice on different levels around the world. This ink and color pencil chart summarizes the complex movements of capital, resources, and people to and from Africa. More specifically, it critiques Europe’s claims of providing development aid while simultaneously exploiting African countries for their resources. As in many of his graphics, Rekacewicz represents the entangled complexity of migration flows, the economy, and resource extraction, offering a tool for better understanding contemporary exploitation in some parts of the world.


FONDAZIONE PRADA
Fondazione
Prada, a cultural institution created in 1993 by Miuccia Prada and Patrizio
Bertelli, operates in the belief that art and study are useful and necessary to
understand the changes unfolding in the world through new and engaging
perspectives.
As President and Director
Miuccia Prada stated, “Right from the start, through the Fondazione’s
activities I aspired to investigate human culture in all its variety and
complexity. Over these thirty years, I have wondered in different ways how
artistic and intellectual research can impact people’s lives. Searching for
increasingly topical answers to this question is the fundamental objective I
have set myself with the foundation.”
In its first two decades,
Fondazione commissioned utopian projects and monographs in Italy and abroad to
renowned international figures, as well as established and emerging artists.
Since 2002, it has undertaken research studies of subjects which had previously
been unexplored, through conferences of philosophical nature, exhibitions about
architecture and initiatives focused on cinema.
A vast network of
collaborations with artists, curators, scientists, scholars, filmmakers,
architects, musicians, and intellectuals, offering an extensive cultural
program within its three Italian venues, two in Milan and one in Venice, opened
respectively in 2015 and 2011, as well as Shanghai and Tokyo since 2018,
establishes a dialogue with an international and plural audience.
In 2011, Fondazione
Prada’s exhibition space in Venice, the 18th-century palazzo Ca’ Corner della
Regina, was inaugurated after a building restoration aimed at preserving its
artistic and architectural heritage. Every year, on the occasion of the Art and
Architecture Biennales, Fondazione Prada presents research exhibitions and
experimental projects at this location.
The Milan venue was
opened in 2015 and designed by architecture firm OMA studio, led by Rem
Koolhaas. Its articulation reflects the multidisciplinary vocation of the
Fondazione, establishing its role as a laboratory of ideas, a space where the
coexistence of disciplines and languages generates resonances and unpredictable
cultural intersections. Its program includes art and archaeological
exhibitions, scientific projects and conferences, musical events, dance
performances and educational activities. Permanent installations and
site-specific interventions by contemporary artists trace the history and
identity of the Fondazione, enhancing its cultural offering.
Since 2016, Osservatorio,
Fondazione Prada’s an exhibition space located inside Galleria Vittorio
Emanuele II in Milan, has been dedicated to the exploration of visual languages
and research on the intersections and connections between technologies and cultural
expressions.
Over the past two
decades, Fondazione Prada has supported numerous initiatives within cinema,
exploring the links between moving images and the visual arts. With its weekly
screening program, the Fondazione aims at enhancing the broad spectrum of film
creation, both contemporary and past, in all its richness and diversity. In
2023, Fondazione Prada’s movie theater at the Milan venue was renamed Cinema
Godard, to strengthen the bond with the Franco-Swiss filmmaker Jean-Luc Godard,
who in 2019 conceived and realized for the Fondazione only two permanent
installations open to the public: “Le Studio d’Orphée” and “Accent-soeur”.
The ‘Human Brains’
project is the result of an in-depth research process, undertaken in 2018 in
the neuroscience sector, with the support of a scientific committee. The
project is driven by a strong deep interest to understand the human brain, the
complexity of its functions, and its centrality in human history. For a
cultural institution such as the Fondazione, ‘Human Brains’ represents a
challenge, as it helps to give voice to the ideas of researchers that have a
concrete impact on the lives of every individual.
Since 2018, Fondazione
Prada has further expanded its reach by also presenting its activities in two
international centers in China and Japan. Prada Rong Zhai in Shanghai, Prada
Aoyama in Tokyo regularly host a series of projects such as research
exhibitions, monographs, artistic commissions and public meetings with scholars
and personalities from the world of culture, presented by Prada with the
support of the Fondazione.
In 2023, a Steering
Committee was established to work closely with the President and Director
Miuccia Prada and the Fondazione’s staff. Its main task is to identify the most
stimulating research areas to develop multidisciplinary projects that can
impact on the contemporary cultural debate. Each member of the committee
contributes to an intense theoretical discussion stemming from their individual
expertise and background: from education and visual studies to science, from
social practices to cinema, visual languages, and dialogues between cultures.
Fondazione Prada fosters
participation and inclusivity by embracing a multiplicity of identities,
sensibilities and paradigms raised by communities and individuals. Particular
attention is paid to youth and their development through a series of projects
conceived for children and students, as well as educational and exhibition
activities created in collaboration with Italian and international schools,
universities, and research centres in the fields of visual arts, science and
humanities.
https://www.fondazioneprada.org/mission-en/?lang=en


WAR TACTICAL
SCHEME, 20th CENTURY
Thai
Manuscript on the Art of War
Hs. or. 9564,
Staatsbibliothek zu Berlin –
Preußischer Kulturbesitz, Berlin


CHARLES –
JOSEPH MINARD
Hannibal’s
Path From Iberia (Spain), Across Southern Gaul (France),
Across the
Alps and Into Italy | The Successive Losses of French army’s
Men During
the Russian Campaign 1812–13, 1869
Print on
paper
École
Nationale des Ponts et Chaussées, Champs-sur-Marne
Courtesy
Collection de École Nationale des Ponts et Chaussées, Champs-sur-Marne
Described as one of the “best statistical charts ever created,” this diagram by Charles Joseph Minard stands out for its synthesis and clarity of exposition. The chart compares the causes of defeat of Napoleon’s campaign in Russia and Hannibal’s path across the Alps, reporting as many as six different metric factors—such as geography, event chronology, troops’ arrangement, temperature—on a bidimensional space.


MOVEMENT OF
THE TROOPS IN THE LENA AYERSTEDT BATTLE, 1806
Printed Book
In Napoleon
Bonaparte, “Ersten Kaisers der Franzosen Feldzüge im Jahr 1805:
Historisch-politisch bearbeitet” (Altona: Bechtold, 1806)
46 MA 2419, Staatsbibliothek zu Berlin – Preußischer Kulturbesitz, Berlin

THE WORLD
MODEL, 1972
Printed Book
In Donella H.
Meadows, Dennis L. Meadows, Jørgen Randers, William Behrens III,
The Limits to
Growth. A Report for the Club of Rome’s Project on the
Predicament
of Mankind (New York: Potomac Associates – Universe Books, 1972)
Private
Collection
Courtesy of
the Authors via System Dynamics Society
This diagram schematizes the complex global development model, based on the extractive economy and predictions of infinite growth. It was published in 1972 on The Limits to Growth, one of the first texts that theorized the need of a “degrowth” and that inspired the environmental movement.


PEAK
STREAMFLOWS IN CALIFORNIA FROM 1905 to 1975, 1979
Printed Book
In William L.
Kahrl, William A. Bowen, Marlyn L. Shelton, David L. Fuller,
Donald A.
Ryan, Stewart Brand, The California Water Atlas (State of California,
Sacramento, CA: Governor’s Office of Planning and Research, 1979)
Private
Collection
Courtesy
California Governor’s Office of Planning and Research
This diagram is excerpted from The California Water Atlas, a volume written at the end of the 1970s that highlights the water policies in California and condemns supply issues. The goal is to provide citizens with a resource to understand how the Californian water system works, underlying the importance of water.

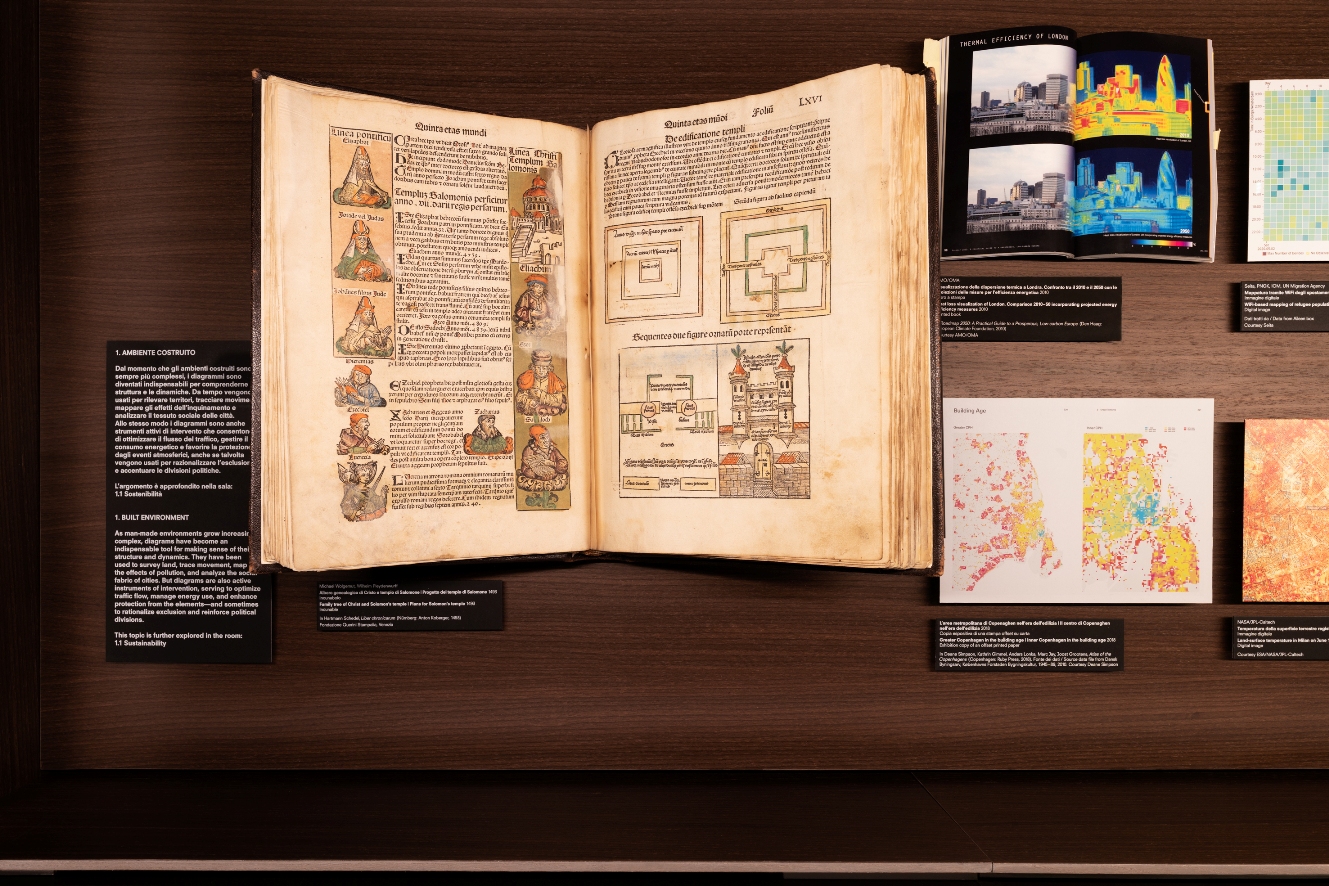

MICHAEL
WOLGEMUT, WILHELM PLEYDENWURFF
Family Tree
of Christ and Solomon’s Temple | Plans for Solomon’s Temple, 1493
Incunable
In Hartmann
Schedel, “Liber chronicarum” (Nürnberg: Anton Koberger, 1493)
INC. 9,
Biblioteca Nazionale Marciana, Venezia


REPUBLIC OF
TURKEY MINISTRY OF INTERNAL AFFAIRS
Statistical Chart For the Year 1340 [1924] Given by the
Ministry of Justice to Police
Departments, Recording the Number of People Released
and not
Released by the Courts, 1924
Exhibition
Copy of a Print on Paper
David Rumsey
Map Collection, David Rumsey Map Center,
Stanford
University Libraries
Courtesy
David Rumsey Map Collection,
David Rumsey
Map Center, Stanford University Libraries
This chart, promoted by the newly formed Turkish Republic, highlights the success of the new secular court system in contrast with the religious one. Yellow corresponds to 1923, the last year of the religious tribunal, while the other colors indicate 1924 and later. The lines show a significant increase in court cases and a corresponding rise in prosecutions due to the new system.


WÃQIDI
GEOGRAPHY MAP, 1281
1864
Reproduction of a Map Included in Ğuġrāfiyā (Geography), 1281,
Manuscript
Ms. or. fol. 3177, Wāqidī, Ğuġrāfiyā 1281 [1864] 449 Bl.: 14
Miniaturen,
Staatsbibliothek zu Berlin – Preußischer Kulturbesitz, Berlin
Courtesy
Staatsbibliothek zu Berlin - Preußischer Kulturbesitz
This 19th-century Persian manuscript reproduces content from a more ancient 13th-century text. It schematizes the Middle East’s geography, with rivers indicated in blue. Colored circles identify human settlements, such as Tehran, Baghdad, and Mosul.


ALEXANDRE
VUILLEMIN
Cross Section
of the Earth’s Crust, 1863
Printed book
In Louis
Figuier, “La Terre Avant le Déluge” (Paris: Hachette, 1863)
Biblioteca
del Museo di Storia Naturale e dell’Acquario Civico, Comune di Milano, Milano

THE IMAGERY
FUNCTION OF THE EGO AND
THE DISCOURSE
OF THE UNCONSCIOUS, 1954–55
Printed book
In Jaques
Lacan, Il seminario. Libro II. L’io nella teoria di Freud e nella tecnica della
psicoanalisi (Turin: Einaudi, 2006 [1954–55])
Private
collection
Courtesy
Giulio Einaudi Editore, Turin
Jacques Lacan’s so-called ‘L scheme’ is one of the main theoretical tools for describing the structure of intersubjective relations—that is, how a subject constitutes itself in relationship with the Other and itself. Introduced in 1955, it represents the opposition between the Imaginary and the Symbolic, a fundamental concept in Lacan’s psychoanalytic theory.


THE HUMAN
BODY, SHOWING A CIRCULATORY SYSTEM:
FRONT AND
BACK VIEWS, N.D.
China,
Woodcut, Exhibition Copy
Wellcome
Collection, London
Courtesy
Wellcome Collection, London
In this woodcut, energy meridians and acupuncture points used in traditional Chinese medicine are shown on two stylized human figures. Lines flowing through the bodies represent the paths of meridians—the channels through which vital energy is said to flow.

THE HUMAN BODY, SHOWING A CIRCULATORY SYSTEM:
FRONT AND BACK VIEWS, N.D. (DETAIL)


PERSPECTIVE
SKETCH OF THE UNIVERSAL HISTORY FROM
THE CREATION
TO THE EMPIRE OF NAPOLEON, 1836
Exhibition
Copy From a Printed Book
In Emma
Willard, Universal History in Perspective (Hartford: F.J. Huntington, 1836)
David Rumsey
Map Collection, David Rumsey Map Center,
Stanford
University Libraries Courtesy David Rumsey Map Collection,
David Rumsey
Map Center, Stanford University Libraries
In the Atlas to Accompany a System of Universal History (1836), Emma Willard (1787–1870) gives visual overviews of history. As she explained, the achievement of this Atlas was that “we have here brought before the eye, at one glance, a sketch of the whole complicated subject of Universal History.” As an educator, Willard believed that comprehensive visual summaries would help students learn and retain information more effectively. This “Picture of Nations or Perspectival Sketch of the Course of Empire” appears very dated today, with its strong focus on the history of the West. However, as an image, it certainly provides a condensed visual summary of the history, which is what Willard wanted to convey.

PERSPECTIVE SKETCH OF THE UNIVERSAL HISTORY FROM
THE CREATION TO THE EMPIRE OF NAPOLEON, 1836 (DETAIL)


REM KOOLHAAS
Rem
Koolhaas (Rotterdam 1944) founded OMA in 1975 together with Elia and
Zoe Zenghelis and Madelon Vriesendorp. Koolhaas worked as a journalist and
screenwriter before beginning architecture, and writing has remained central to
his architectural practice. At the same time as designing buildings around the
world with OMA, Koolhaas works in non-architectural disciplines – including
politics, publishing, media, fashion, and sociology – through his think tank
and research unit, AMO.
After studying at the
Architectural Association in London, and at Cornell and the Institute for
Architecture and Urban Studies in the US, Koolhaas wrote Delirious New
York (1978) and simultaneously began producing projects and proposals with
OMA. In 1995, S,M,L,XL summarized the work of OMA in a
1,200-page book that redefined architectural publishing. As director of the
Project on the City research program at Harvard University, Koolhaas produced
the books The Harvard Guide to Shopping (2001), an analysis of
the role of retail and consumption in society and architecture, and Great
Leap Forward(2002), a study of China’s Pearl River Delta; he also produced
studies on Lagos, Roman architecture and communism.
Recently completed OMA
buildings include De Rotterdam, three interconnected towers on the river Maas;
Shenzhen Stock Exchange; the G-Star headquarters in Amsterdam; the new
headquarters for China Central Television (CCTV) – a tower reinvented as a loop
– in Beijing; a new headquarters for Rothschild Bank in London; and Milstein
Hall, an elevated slab that extends Cornell’s college of Architecture, Art and
Planning.
OMA-designed buildings
currently under construction include the Taipei Performing Arts Centre; three
buildings in Doha, Qatar; the Bibliothèque Multimédia à Vocation Régionale, a
four-story public library in Caen; and Bryghusprojektet in Copenhagen, a
mixed-use project accommodating the new headquarters for the Danish
Architecture Centre.
In 1998, Koolhaas
established AMO as a platform for using architectural thinking in
non-architectural realms. Recent AMO projects include research into the
countryside (globally) and the Russian hinterland; the design of catwalk shows
for Prada and Miu Miu; “Cronocaos,” an exhibition on preservation, at the 2010
Venice Biennale; participation in the EU Reflection Group think tank, with the
task of making proposals for Europe in 2020; Roadmap 2050, a masterplan
for a Europe-wide renewable energy grid; and the development of an educational
program for Strelka, a new architecture school in Moscow. AMO has also guest
edited an issue of Wired magazine as well as consulting on the
future of Conde Nast magazines; proposed a “barcode” EU flag; and developed a
curatorial masterplan for the Hermitage museum, St. Petersburg.
SELECTED BUILDINGS
De Rotterdam, Rotterdam,
2013
CCTV Headquarters,
Beijing, 2012
Rothschild Bank, London,
2012
Millstein Hall, Cornell,
NY, 2010
Maggie’s Center,
Gartnavel, 2010
Wyly Theatre, Dallas,
2009
Prada Transformer, Seoul,
2009
Serpentine pavilion, London,
2006
Zeche Zollverein Museum
and masterplan, Essen, 2006
Seoul National University
Museum of Art, 2006
Casa da Música, Porto,
2005
Prada Epicenter, New
York, 2001
Seattle Central Library,
2004
Netherlands Embassy,
Berlin, 2003
IIT Campus Center, Chicago,
2003
Hermitage Guggenheim, Las
Vegas, 2001
Maison à Bordeaux, 1998
Educatorium, Utrecht,
1997
Euralille Congrexpo +
masterplan, 1994
Kunsthal, Rotterdam, 1992
Nexus World Housing,
Fukuoka, 1991
Villa d’allava, Paris,
1991
Netherlands Dance
Theatre, The Hague, 1987
SELECTED BOOKS
Project Japan: Metabolism
Talks, Taschen, 2011
Al Manakh
I and II, Archis, 2007 and 2010
Content, Taschen, 2003
Great Leap Forward,
Taschen, 2002
Harvard Guide to
Shopping, Taschen 2001
S,M,L,XL, Monacelli, 1995
Delirious New York,
Oxford University Press, 1978
SELECTED EXHIBITIONS
(Im)pure, (In)formal,
(Un)built, L’Ecole des Beaux-Arts, Paris, 2011
OMA/Progress, Barbican,
London, 2010
Cronocaos, Venice
Biennale, 2010
Dubai Next, Vitra Design
Museum, Weil am Rhein, 2008
The Gulf, Venice
Biennale, 2006
OMA in Beijing, MoMA, New
York, 2006
Expansion and Neglect,
Venice Biennale, 2005
Image of Europe: Vienna,
Brussels, Munich, 2004
Content, Neue
Nationalgalerie, Berlin, 2003
Cities on the Move,
Hayward Gallery, London, 1999
Less is More, Milan
Triennale, 1986
Strada Novissima, Venice
Biennale, 1980
TEACHING POSITIONS
Strelka Institute, Moscow
Professor in Practice of
Architecture and Urban Design, Harvard University
Architectural
Association, London
Institute for
Architecture and Urban Studies, New York
SELECTED AWARDS
Johannes Vermeer Prijs,
2013
Golden Lion for Lifetime
Achievement, Venice Biennale, 2010
RIBA Gold Medal, 2004
Praemium Imperiale,
Japan, 2003
Membership Legion
D’Honneur, 2001
Pritzker Prize, 2000
Mies van der Rohe Award,
2005
EDUCATION
Architectural
Association, London, 1969–72
Cornell University, 1972–73

OMA / AMO
OMA is an international
practice operating within the traditional boundaries of architecture and
urbanism. AMO, a research and design studio, applies architectural thinking to
domains beyond.
OMA is led by seven
partners – Rem Koolhaas, Reinier de Graaf, Shohei Shigematsu, Iyad Alsaka,
Chris van Duijn, Jason Long, and Managing Partner-Architect David Gianotten –
and maintains offices in Rotterdam, New York, Hong Kong, and Australia.
OMA-designed buildings
currently under construction are the New Museum expansion in New York City, 730
Stanyan in San Francisco, The Perigon in Miami, Museo Egizio in Turin, Dhaka
Tower in Bangladesh, Palais de Justice in Lille, Harajuku Quest in Tokyo,
Hangzhou Prism, CMG Times Center in Shenzhen, and Bajes Kwartier in Amsterdam.
OMA’s completed projects
include Simone Veil Bridge in Bordeaux (2024), LANTERN in Detroit (2024),
Mangalem 21 in Tirana (2023), Aviva Studios – Factory International in
Manchester (2023), Apollolaan 171 in Amsterdam (2023), Buffalo AKG Art Museum
in Buffalo (2023), Toranomon Hills Station Tower in Tokyo (2023), Taipei
Performing Arts Center in Taipei (2022), Eagle + West in Brooklyn (2022),
Audrey Irmas Pavilion in Los Angeles (2022), POST Houston (2021), Tenjin
Business Center in Fukuoka (2021), Norra Tornen in Stockholm (2020), Axel
Springer Campus in Berlin (2020), and Potato Head Studios in Bali (2020).
Earlier buildings include Fondazione Prada in Milan (2018), Pierre Lassonde
Pavilion in Quebec City (2016), Faena Forum in Miami (2016), De Rotterdam
(2013), CCTV Headquarters in Beijing (2012), Milstein Hall at Cornell
University (2011), Casa da Música in Porto (2005), the Seattle Central Library
(2004), and the Netherlands Embassy in Berlin (2003).
AMO often works in
parallel with OMA’s clients to fertilize architecture with intelligence from an
array of disciplines. AMO first collaborated with Prada to design the brand’s
Epicenter stores in New York (2001) and Los Angeles (2002), and since 2004 has
been responsible for designing the brand’s runway shows. AMO was commissioned
by the European Union to study its visual communication, and designed a colored
“barcode” flag, which was used during the Austrian presidency of the EU in
2004.
AMO has worked with
Universal Studios, Amsterdam’s Schiphol Airport, Heineken, Ikea, Condé Nast,
Harvard University, Stone Island, and the Islamic Arts Biennale. It has
produced Countryside: The Future, at the Solomon R. Guggenheim Museum in New
York; exhibitions at the Venice Architecture Biennale, including Public Works
(2012), Cronocaos (2010), and The Gulf (2006); When Attitudes Become Form
(2012), Serial and Portable Classics (2015) and Recycling Beauty (2022) at
Fondazione Prada. AMO, with Harvard University, was responsible for the
research and curation of the 14th Venice Architecture Biennale and its
publication Elements of Architecture (2014).
https://www.oma.com/office


.png)